
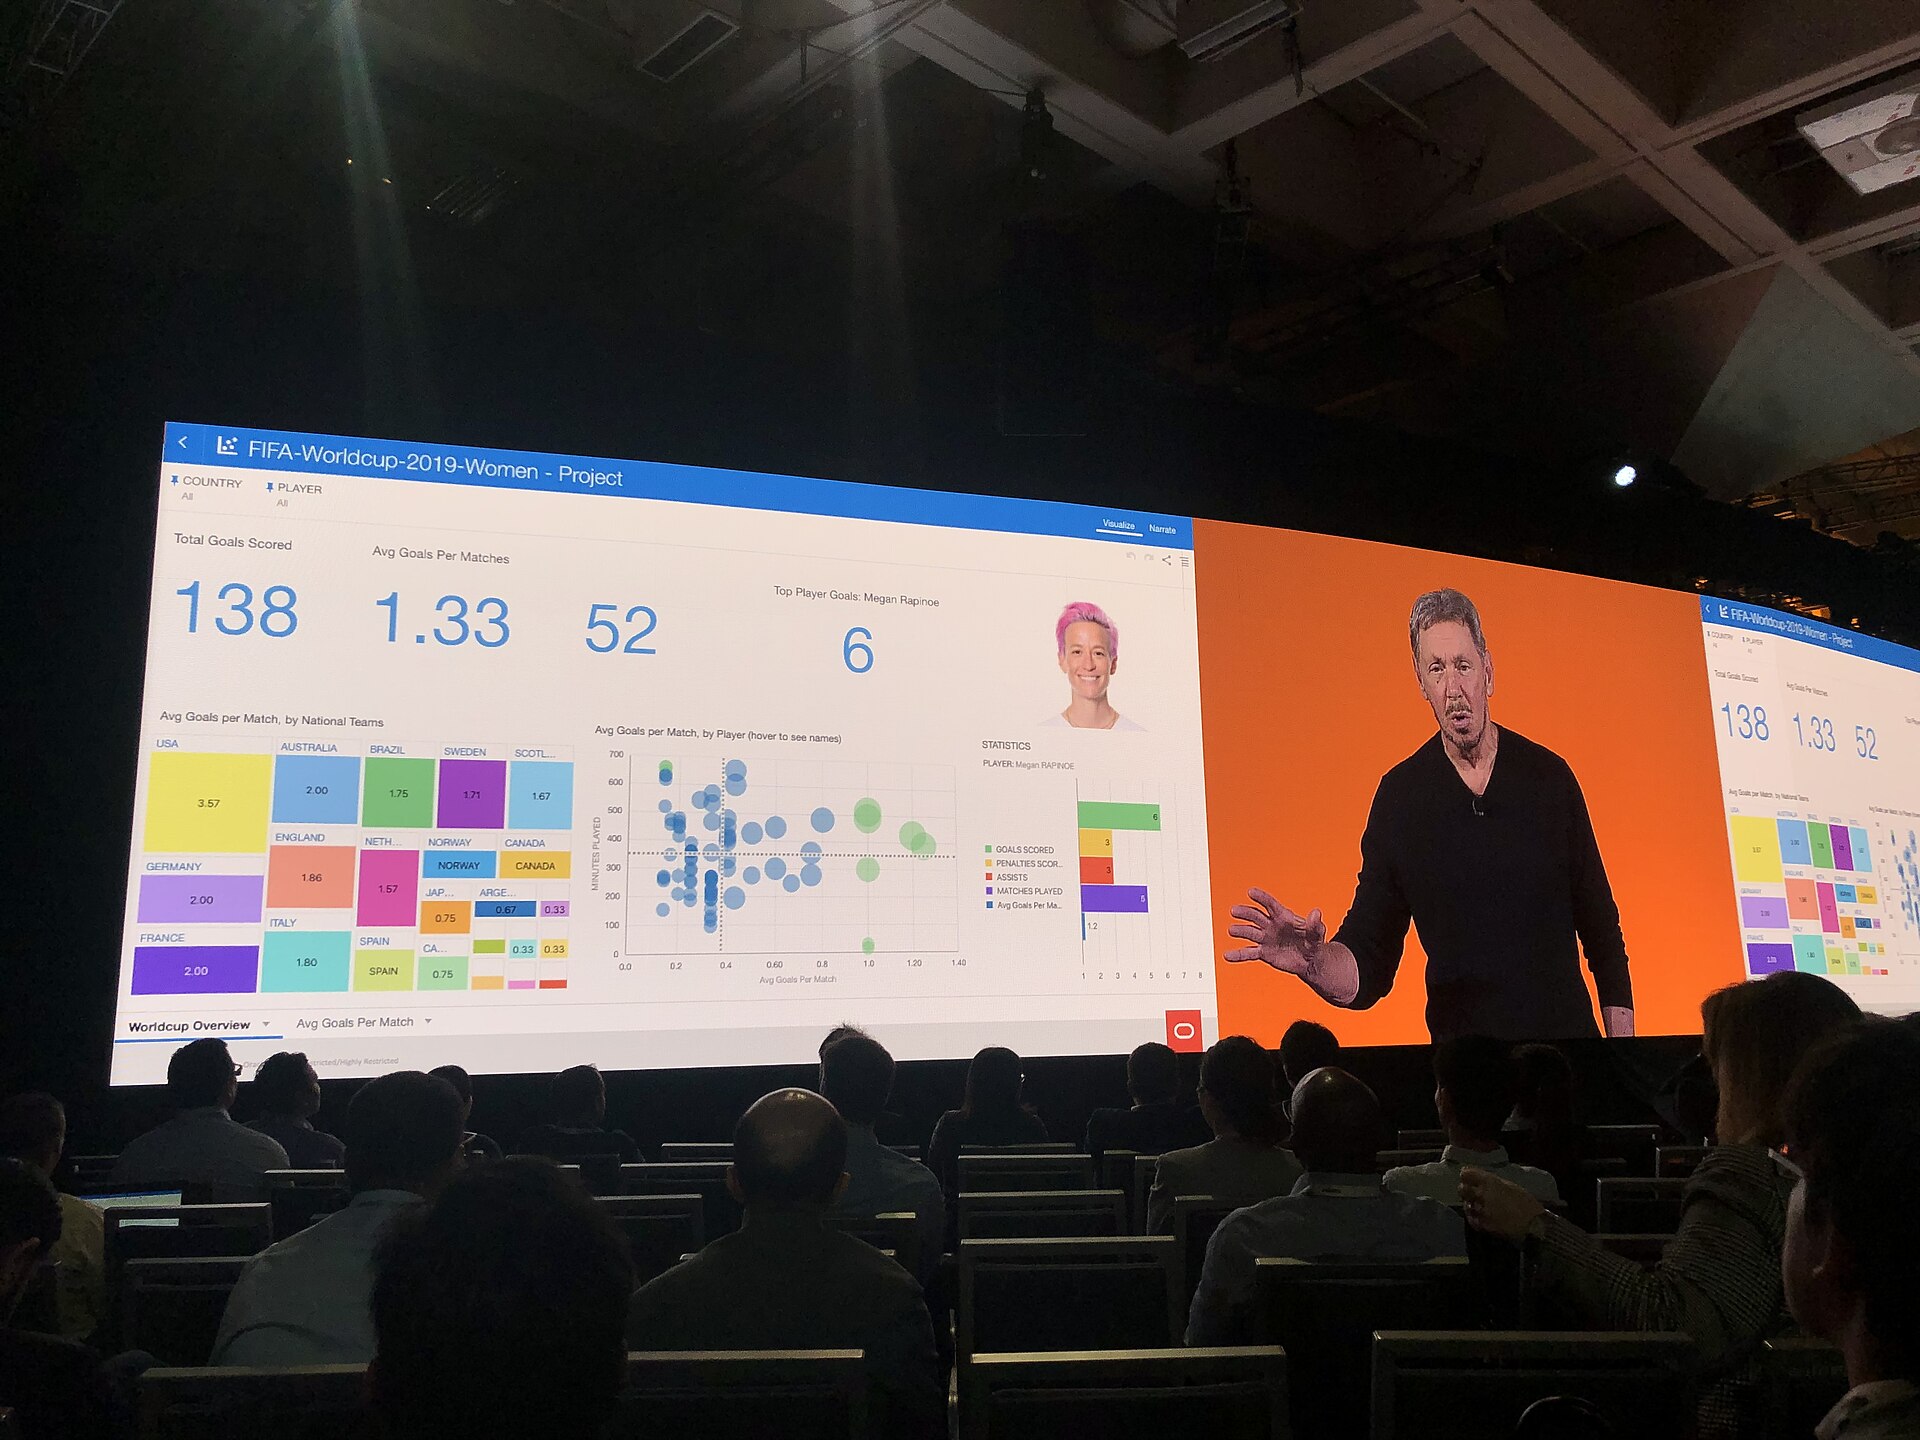
If you’re tracking sales, expenses, leads, or website traffic in a pile of spreadsheets, you don’t need an expensive BI tool to turn that data into something you can actually glance at and understand. Google Sheets and Data Studio, Google’s free dashboard and reporting tool (you may still see it called Looker Studio in older guides, since Google renamed it back to Data Studio in April 2026), can be connected in a few minutes to build a live reporting dashboard that updates itself.
Table of Contents
This guide walks through the full setup: organizing your data in Sheets so it plays nicely with a dashboard, connecting it to Data Studio, building your first charts, and avoiding the mistakes that make dashboards slow, wrong, or unreadable.
Quick Answer
Put your business data in a well-structured Google Sheet, then open Data Studio (datastudio.google.com), create a new report, choose Google Sheets as the data source, select your file and tab, and start adding charts. Data Studio is free to use and will automatically refresh from your sheet on a schedule you control.
Step-by-Step: From Spreadsheet to Dashboard
Start with the data, not the dashboard. In Google Sheets, keep your raw data in a single tab formatted as a clean table: one header row, one row per record (a sale, a lead, an expense), and no merged cells, blank rows, or subtotals mixed in. Data Studio reads this like a database table, so messy formatting causes broken charts later. If you’re pulling data from multiple sources, consider a separate tab per source and a final tab that consolidates them.
Create your report. Go to datastudio.google.com and sign in with the same Google account that owns your spreadsheet. (If you land on an old lookerstudio.google.com bookmark, it will redirect automatically — Google renamed the product from Looker Studio back to Data Studio, and existing reports and links carried over without any action needed.) Click ‘Blank Report,’ then choose ‘Google Sheets’ from the list of connectors. Pick your spreadsheet file, then the specific tab that holds your clean data, and confirm the connection. Data Studio will scan the columns and guess data types (text, number, date) — check these and fix any that were misread, especially date columns.
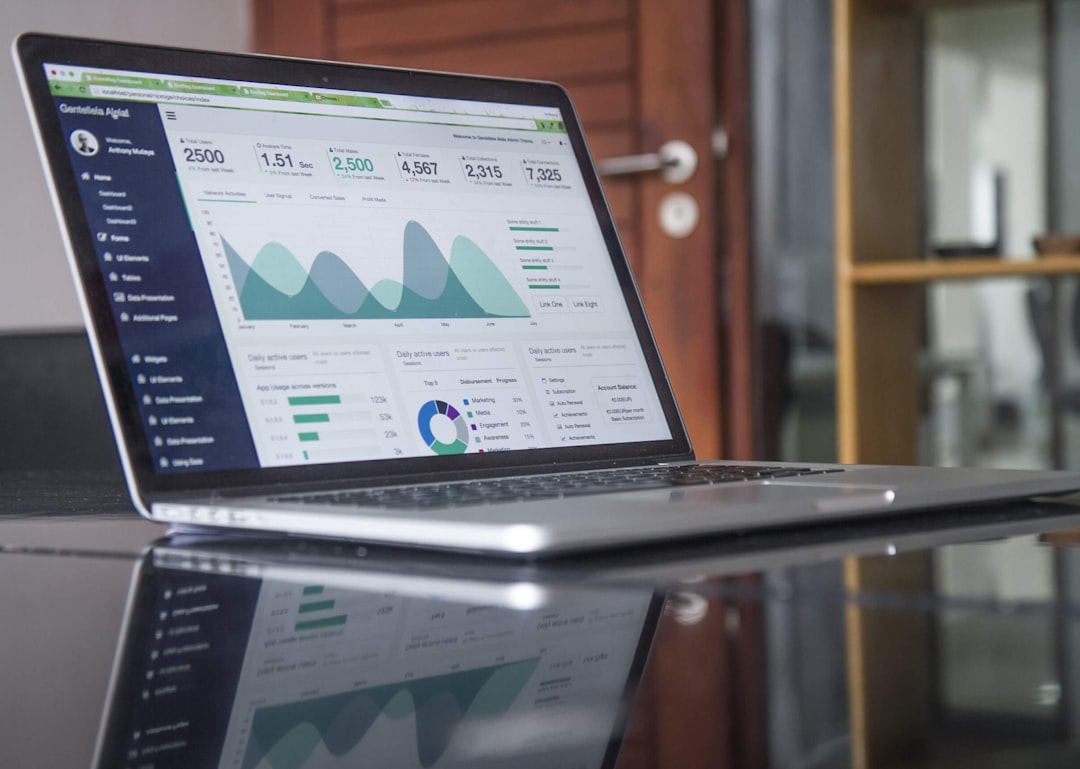
Add your first charts. Data Studio drops you into an empty canvas. Use the ‘Add a chart’ menu to insert scorecards (single big numbers like total revenue or total leads), time-series charts (revenue by month), bar charts (sales by product or rep), and tables (a detailed breakdown). Drag fields into the Dimension and Metric boxes on the right to control what each chart shows.
Add filters and date controls. A date range control (under Add a control) lets anyone viewing the dashboard change the time window without editing the report. Filters by category, region, or salesperson work the same way and make one dashboard useful to a whole team instead of building five versions.
Set the refresh schedule and share it. Data Studio refreshes Google Sheets data on an interval you can adjust in the data source settings — check your current settings, since defaults can change. Once it looks right, click Share to send a link, or schedule automatic email delivery of a PDF snapshot to stakeholders who don’t want to log in.
What This Setup Is Good (and Not So Good) For
This combination is well suited to small and mid-sized datasets: weekly sales summaries, marketing lead trackers, expense logs, inventory counts, or KPI trackers that a small team updates by hand or through simple exports. Because both tools are free and use accounts most small businesses already have, there’s no new subscription to justify.
It’s less suited to very large datasets or true real-time needs. Big sheets (tens of thousands of rows with complex formulas) can slow report loading and occasionally throw errors, and the Sheets connector doesn’t refresh instantly, so it isn’t a fit for live operational monitoring. For those cases, look at connecting Data Studio to a proper database or using Google’s BigQuery connector instead, or check whether Data Studio Pro or a paid connector fits your needs.
Tips / Common Mistakes
Don’t build charts directly off messy raw data — add a ‘clean’ tab with formulas (or a QUERY/FILTER function) that reshapes raw entries into the tidy table Data Studio needs, and connect the dashboard to that tab instead. This keeps your dashboard stable even if you reorganize your raw input sheet later.
Watch out for added or renamed columns. If you insert a new column or rename an existing one in Sheets, Data Studio won’t pick it up automatically — go into the data source and click ‘Refresh Fields’ so the new column becomes available to your charts.
Avoid dozens of tiny charts. A dashboard with 15 small charts is harder to scan than one with 4-6 well-chosen ones (a top-line scorecard, a trend line, a breakdown by category, and a detail table). Decide what decision the dashboard needs to support, then build only the charts that support it.
Double-check who can see it. Data Studio sharing follows Google’s normal sharing permissions, and by default a shared report can also expose the underlying data source unless you control access separately — review the sharing settings on both the report and the connected sheet before sending it outside your team.
Explore more: More small business tech guides.
Google Sheets and Data Studio dashboard FAQs
Is Data Studio really free to use?
Yes. Data Studio is free with a Google account, including connecting to Google Sheets, building reports, and sharing them. A paid Data Studio Pro tier exists for teams that need more control, but it isn’t required for a basic dashboard.
Wait, isn’t this tool called Looker Studio?
It was, from late 2022 until April 2026, when Google renamed it back to Data Studio (its original name) to reduce confusion with the separate enterprise Looker BI platform. Old lookerstudio.google.com links and existing reports carried over automatically to the new name and URL.
How often does a Data Studio dashboard update from Google Sheets?
Data Studio refreshes on an interval you can adjust in the data source settings. Check the current settings in your data source, since refresh options and defaults can change.
Can multiple people edit the underlying Google Sheet without breaking the dashboard?
Yes, as long as the structure (column names and order) stays consistent. If someone adds or renames a column, you’ll need to refresh the data source fields in Data Studio so the dashboard recognizes the change.
Do I need to know how to code to build this?
No. Basic spreadsheet skills (organizing data into rows and columns, maybe a formula or two) and Data Studio’s drag-and-drop chart builder are enough for most small business dashboards.
Build It With GTStudios
Need help with your website, app, or small-business tech? GTStudios builds web, apps, and software for small businesses. See how GTStudios can help.
Photo: GeneralAB13 / CC BY-SA 4.0, via Wikimedia Commons.